Investing in Edmond OK: Top Neighborhoods 2026
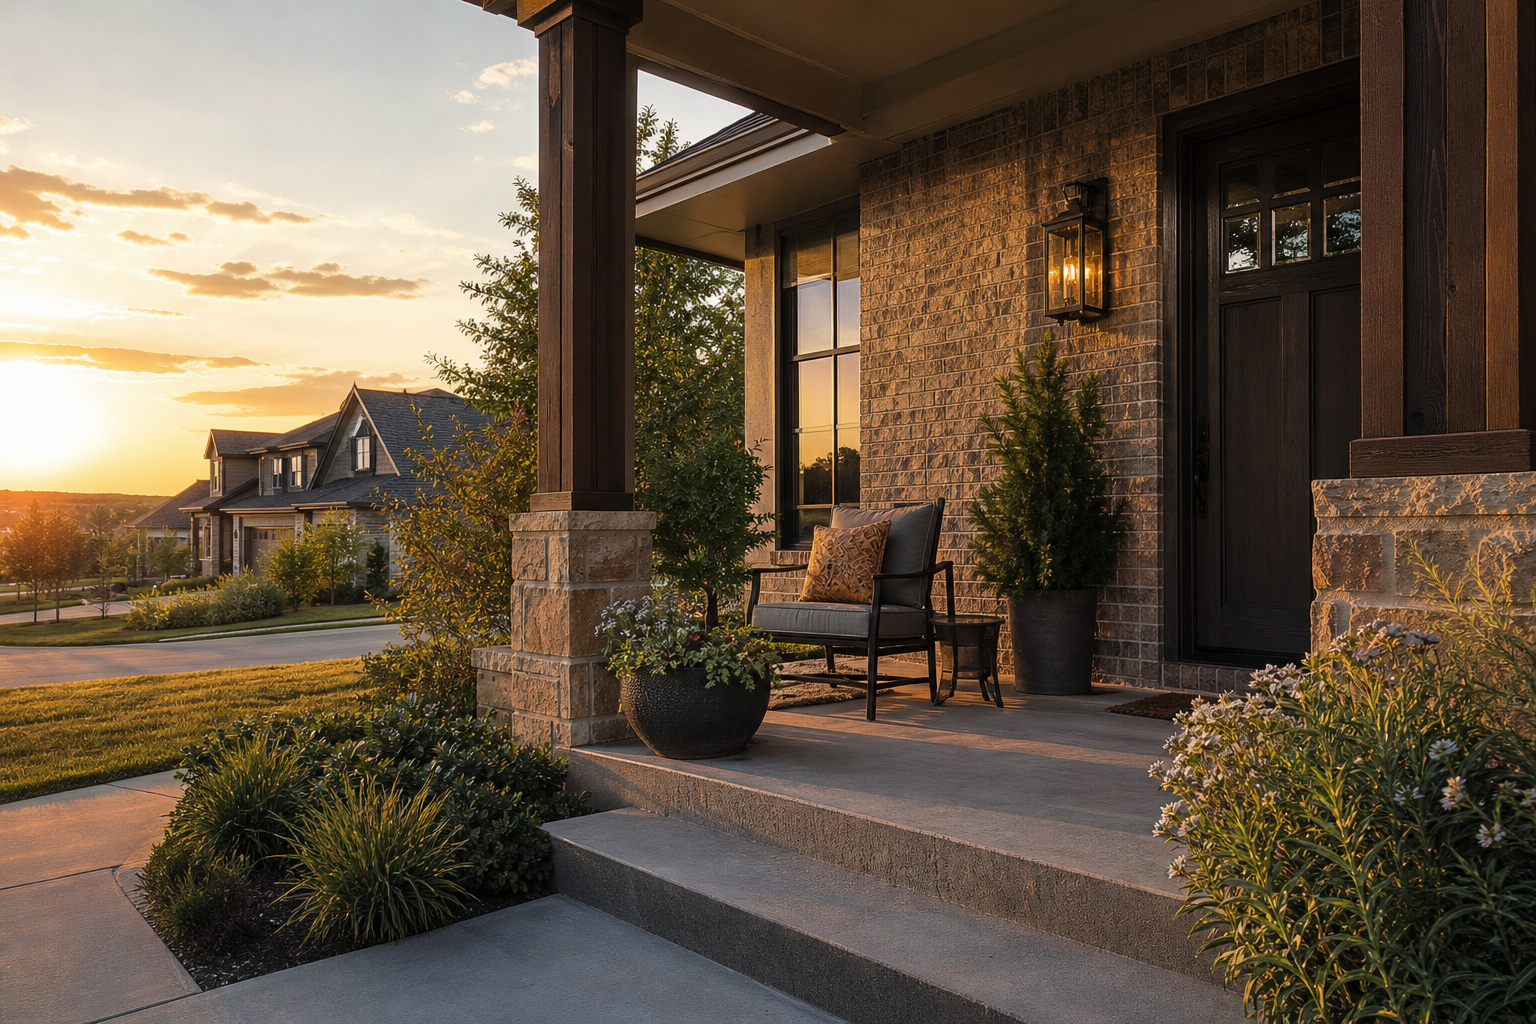
Edmond offers investors a premium OKC metro market with average home values near $358,000–$426,000, strong school-driven demand, and new-build communities like Covell Valley starting around $358,000. Mid-range family product in the $273K–$548K range moves fastest, while north Edmond's I-35/Covell corridor leads for appreciation-focused, long-term holds.
Is Edmond, OK a good place to invest in real estate in 2026?
Edmond is one of the strongest long-term investment markets in the Oklahoma City metro, with average home values well above the metro-wide average, consistent school-driven demand, and a growing pipeline of new construction along the I-35 and Covell Road corridor. Mid-range family product in the $273,000–$548,000 range moves fastest, and communities like Covell Valley give investors access to modern, energy-efficient product at entry-level new-build prices.
If you're evaluating Edmond for a rental purchase, a long-term hold, or a value-add play, here's what the 2026 data actually shows, and where I'd focus my attention.
What the 2026 Edmond Market Actually Looks Like
Let me be direct about something first: depending on which data provider you check, Edmond looks either slightly up or slightly down in 2026. That's not a reason to avoid the market, it's a reason to dig deeper than a headline number.
According to Zillow's Edmond market data, the average home value as of July 31, 2026 sits at approximately $358,694, up 0.7% over the prior year, with homes typically going pending in about 21 days. The median sale price for that same window is around $360,750, and 24.1% of sales are closing over list price.
A July 2026 Journal Record article pegs Edmond home values averaging nearly $426,000, significantly above the metro-wide average of about $270,000. That premium positioning is the core of Edmond's investment thesis.
But here's the nuance. A local market commentary piece noted that three major data providers disagreed on Edmond's mid-2026 trend: one showed a trailing median around $392,000, down roughly 3.9% year-over-year; another showed $388,000, down about 1.9%; while Zillow's index showed a gain of about 2.2% for the same window. The same local commentary pointed out that days on market remain roughly flat in the high-20-day range and sale-to-list ratios are near 98–99%, which tells a different story than a softening median alone.
What does that mean for investors? It means Edmond is not uniformly surging or falling. The right question isn't "is Edmond up or down?", it's "which product type and price band in which neighborhood?" That's exactly the kind of analysis I run for my clients before they make an offer.
Edmond, Oklahoma Housing Market Snapshot
A look at recent Edmond home values, sale prices, price per square foot, market pace, competitive sales activity and rental rates.
| Data Point | Figure | Source / Date |
|---|---|---|
| Average Home Value | ~$358,694 | Zillow July 31, 2026 |
| Median Sale Price | ~$360,750 | Zillow July 31, 2026 |
| Median Sale Price — Local Market Report | $389,288 | OKC Metro Report June 2026 |
| Median Price per Square Foot — Tracked Closings | ~$174 / Sq. Ft. | Resideline Prior 6 months |
| Median Price per Square Foot — Analytics Site | ~$187 / Sq. Ft. | Dynamic.RE August 16, 2026 |
| Typical Days to Pending | ~21–26 Days | Zillow / OKC Metro Report 2026 |
| Sales Closing Over List Price | 24.1% Nearly 1 in 4 sales | Zillow July 31, 2026 |
| Average Rent | ~$1,696 / Month | Zillow July 2026 |
Market figures may differ between sources because of differences in reporting periods, geographic boundaries, property types and calculation methods. Home value, median sale price and price per square foot measure different aspects of the market and should not be treated as directly interchangeable.
Note: Figures above are drawn from multiple aggregator and market-report sources as of mid-to-late 2026. They represent area-level averages, not guarantees of what any specific property will sell or rent for.
Where to Focus: Edmond's Investment Zones
Edmond isn't one market, it's several, layered by price point, property age, and proximity to key demand drivers. Here's how I frame the three main zones for investor clients.
North Edmond: The I-35 and Covell Corridor
This is the area getting the most attention right now, and for good reason. The build-out along I-35 and Covell Road is actively reshaping comps in north and northeast Edmond, with new construction influencing resale pricing in adjacent neighborhoods. Covell Valley by Beacon Homes is a prime example: homes starting around $358,000, floorplans beginning near 1,613 square feet, energy-efficient construction, and direct access to I-35 and Covell Road.
For investors, new construction in this corridor offers lower maintenance exposure in the first decade, modern layouts that attract quality long-term tenants, and a price point that sits right in the sweet spot of Edmond demand. The middle 50% of Edmond closings tracked over the prior six months fell between roughly $273,800 and $548,550, with a median around $385,000. Covell Valley's entry pricing lands squarely in that active range.
The commuter angle matters here too. Easy I-35 access to downtown OKC means this corridor appeals to tenants who work in the metro but want Edmond schools and newer product. That's a deep, durable demand pool for a long-term hold.
One thing to watch: new construction can compress resale values in adjacent older neighborhoods. If you're buying a resale home near active build-out, you need to underwrite that competition carefully. This is exactly the kind of conversation I have with every investor client before they go under contract.
Established Central Edmond
Central Edmond, including areas closer to downtown and the University of Central Oklahoma, offers a different profile. Older housing stock, mature trees, and more established neighborhoods. Price points that often trade below the north-side new-construction range. And the potential for value-add strategies, renovation, cosmetic updates, or repositioning, that newer builds don't offer.
UCO enrollment supports a consistent tenant base for well-located properties. If you're looking at a rehab-oriented strategy or want to buy below the median and force appreciation through improvements, central Edmond deserves a look. The tradeoff is higher maintenance exposure and the need to compete against the appeal of newer product when you go to re-lease or resell.
South and West Edmond, Near the OKC Border
The south and west edges of Edmond, where the city blends into the broader OKC metro, offer shorter commutes into downtown Oklahoma City and some of the more attainable price points within the Edmond market. According to the Journal Record's July 2026 metro analysis, the broader OKC metro's strong job base continues to support commuter-oriented rental demand in these transitional corridors.
These areas can work well for investors who want Edmond's school-district halo at a lower entry price. The key is verifying which specific school zones apply to each property, school assignment matters enormously to tenant demand in this market.
The Investment Case: What's Working and What to Watch
What's Working in Edmond's Favor
Edmond's investment fundamentals rest on a few pillars that don't change quarter to quarter.
First, population growth. Between 2020 and 2025, Edmond's population grew around 10.1%, according to the Journal Record. That's steady, school-driven growth that sustains rental demand for 3–4 bedroom single-family homes with garages and yards.
Second, the school district premium. The same Journal Record piece notes Edmond school districts receiving A-plus grades, which is a major driver for families choosing to rent in Edmond rather than buy in a lower-rated district. That's a structural advantage for investors holding family-oriented product here.
Third, Edmond's premium positioning within the metro. At nearly $426,000 average versus the metro-wide average of about $270,000, Edmond commands a significant premium. That premium reflects real, durable demand, not speculation.
The broader OKC metro backdrop also supports Edmond. A July 2026 OKC metro report shows an average sale price of $341,002, up 7.1% from July 2025, with roughly five months of inventory, a balanced to slightly seller-tilted environment. Well-priced homes in strong school zones like Edmond continue to move quickly at or near list price.
What Investors Need to Watch
Rising inventory at higher price points is the main risk signal right now. Statewide Oklahoma REALTORS® data cited in an August 2026 metro update shows 26,381 listings statewide, up 15.2% year-over-year, with months of supply at 14.9 months for $1M+ homes. Luxury and upper-tier spec builds in Edmond need more careful underwriting than mid-range family product.
The Dynamic.RE analytics snapshot as of August 16, 2026 shows active inventory around 1,074 listings in Edmond, with a price-cut share around 25.2%. That's more price discovery than during the ultra-tight 2021–2022 window. Overpriced listings are sitting. Well-priced, well-located product is still moving.
For investors, this means the days of buying anything in Edmond and watching it appreciate are over. You need to be precise about price band, product type, and location. That's not a reason to avoid the market, it's a reason to work with someone who knows the neighborhood-level data, not just the city-wide averages. I walk my clients through exactly this kind of analysis before we target a property.
If you want to see how Edmond compares to other OKC-area neighborhoods for price stability, our post on top OKC neighborhoods where prices are holding strong adds useful context.
Frequently Asked Questions
Is Edmond still a good place to invest in rental property in 2026, or has it gotten too expensive compared to the rest of the OKC metro?
Edmond is more expensive than the broader OKC metro, average values near $358,000–$426,000 versus a metro average around $270,000, but that premium reflects real demand from school-district-driven families, not speculation. For investors focused on appreciation and tenant quality over pure cash flow, Edmond's fundamentals remain strong. The key is targeting the right price band (mid-range family product moves fastest) and running the numbers on your specific target property, not the city-wide average.
How does Covell Valley compare to older parts of Edmond for long-term appreciation and rental demand?
Covell Valley and the broader I-35/Covell corridor offer newer construction, lower near-term maintenance, and strong commuter appeal, attributes that attract quality long-term tenants willing to pay a premium for modern product. Older central Edmond neighborhoods can offer lower entry prices and value-add potential, but they compete against the ongoing new-build pipeline. For a long-term hold focused on appreciation, the north Edmond corridor has more tailwinds right now; for a value-add or rehab strategy, established central neighborhoods may offer better margins.
Are Edmond homes sitting on the market longer in 2026, or are properties still selling close to asking price?
It depends on the price band and product type. Multiple 2026 sources show well-priced Edmond homes going pending in 21–26 days, with sale-to-list ratios near 98–99%. However, one analytics snapshot shows days on market closer to 51 days with a 25% price-cut share across all active inventory, which reflects the upper-tier and overpriced segments sitting longer. According to Realtor.com's Edmond market data, homes sold for approximately asking price on average in June 2026, so the market rewards accurate pricing and penalizes optimistic ones.
How do Edmond's school ratings and population growth affect demand for single-family rentals?
Significantly. Edmond's school districts carry A-plus ratings, according to the Journal Record, and the city grew roughly 10.1% between 2020 and 2025. Families who can't yet afford to buy, or who are new to the metro and want to establish residency before purchasing, actively seek rentals in Edmond specifically for school access. That creates a durable demand pool for 3–4 bedroom single-family rentals, particularly in neighborhoods with confirmed school-zone assignments.
Which price ranges in Edmond are moving fastest, and which segments are seeing more price cuts?
Mid-range family product in the roughly $273,000–$548,000 band, which captures the middle 50% of tracked Edmond closings, moves fastest, with days-to-pending in the low-to-mid 20s for well-priced homes. Upper-tier and luxury inventory is where price cuts and longer market times concentrate, with statewide months-of-supply data showing 14.9 months for $1M+ homes. Investors focused on the mid-range family segment face a more competitive environment; those eyeing upper-tier product have more negotiating room but also more risk.
Ready to run the numbers on a specific Edmond property? I work with investors across Covell Valley, Woodland Park, Timbercrest, Ridge Creek, and the broader OKC metro every day. Schedule a consultation and let's build a real investment analysis around your target neighborhood, price point, and hold strategy, not just a city-wide average.
About Ralph & Cassi Justiz
Ralph and Cassi Justiz are Oklahoma City Metro Area real estate specialists with The Justiz League Real Estate Team, focused on helping buyers, sellers, and investors navigate Edmond and surrounding communities including Woodland Park, Covell Valley, Timbercrest, Ridge Creek, and Cottage Grove. Their hands-on approach to neighborhood-level market analysis helps clients make confident, data-grounded decisions.
Equal Housing Opportunity. This article is provided for general informational purposes only and does not constitute legal, tax, or financial advice. Market data cited reflects aggregator and third-party sources as of mid-to-late 2026 and may not reflect current conditions. Consult your closing agent, tax advisor, and lender to confirm figures relevant to your specific transaction.